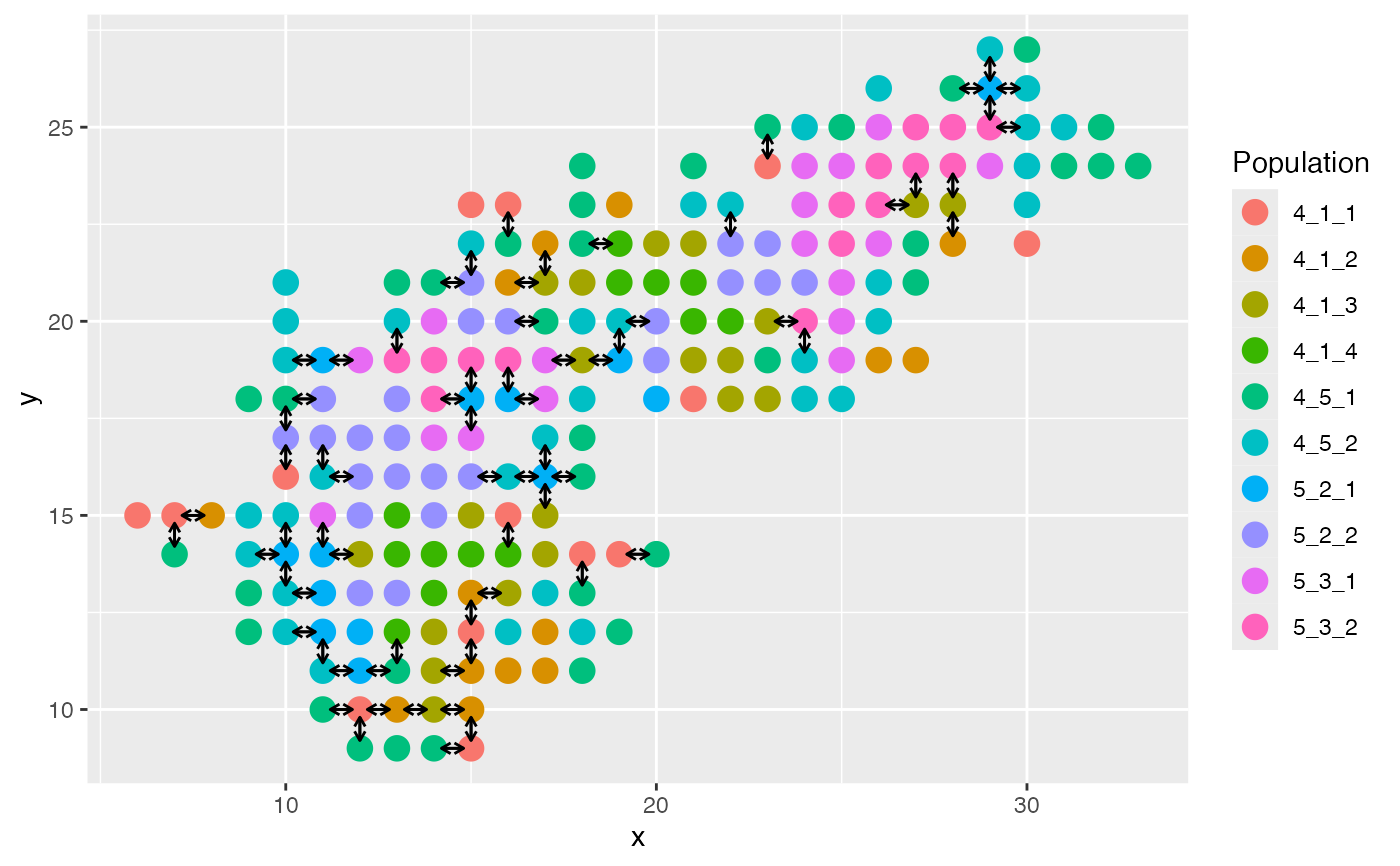
Plot cell locations
Usage
plot_cell_loc(
  results = .getResultsFromGlobal(),
  size = 4,
  show.label = FALSE,
  show.arrows = TRUE,
  lr.pair = 1,
  .cell.pop = NULL,
  .locs = NULL
)
Arguments
- results
The scMultisim result object
- size
Fig size
- show.label
Show cell numbers
- show.arrows
Show arrows representing cell-cell interactions
- lr.pair
The ligand-receptor pair used to plot CCI arrows
results$cci_cell_type_param[lr.pair]- .cell.pop
Specify the cell population metadata
Examples
results <- sim_example_200_cells_spatial()
#> CCI simulation is enabled.
#> Get CIF...100..200..Done
#> Get params...Done
#> Simulating...50..100..150..200..
#> Time spent: 2.17 mins
plot_cell_loc(results)