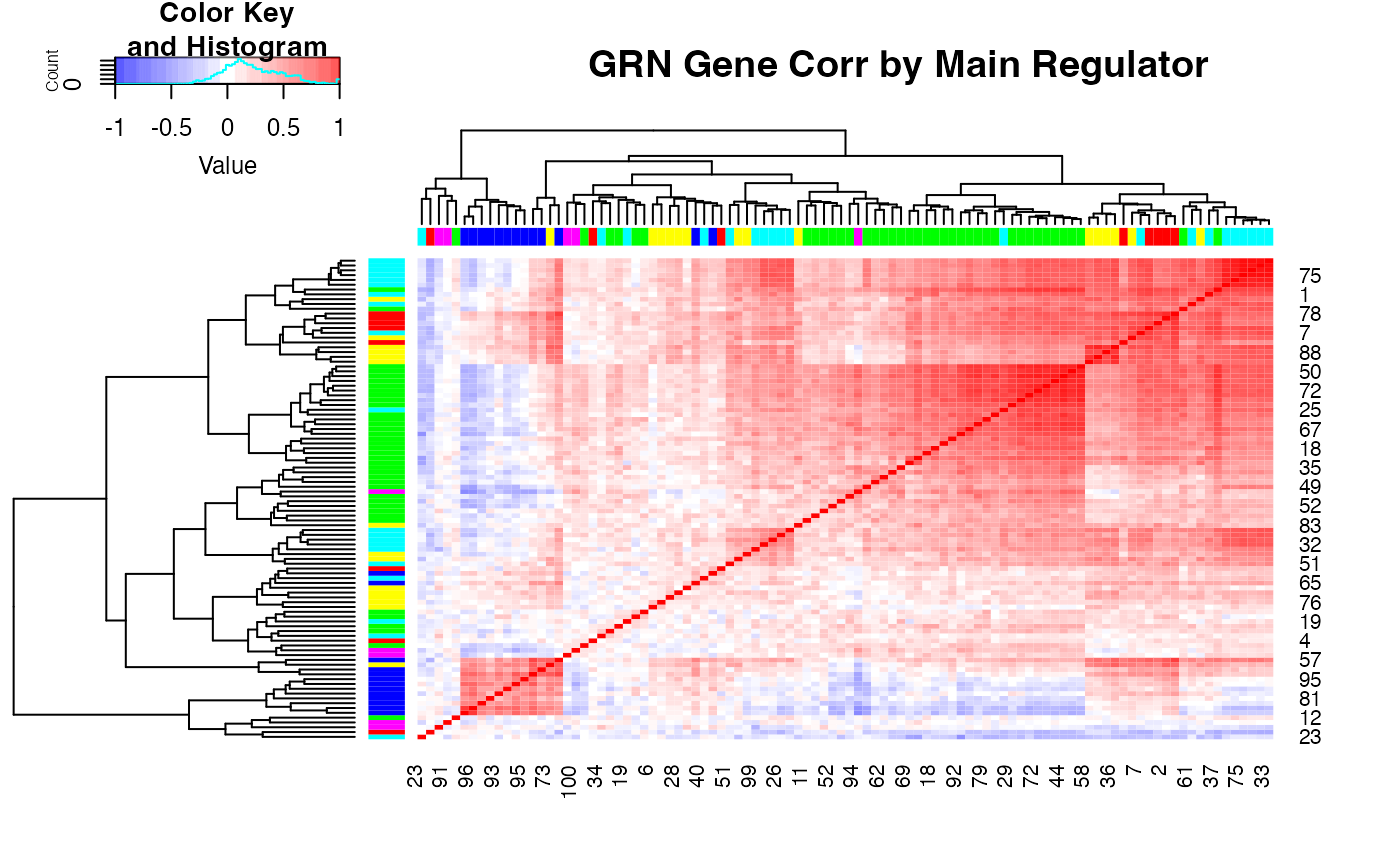
Plot the gene module correlation heatmap
Usage
plot_gene_module_cor_heatmap(
  results = .getResultsFromGlobal(),
  seed = 0,
  grn.genes.only = TRUE,
  save = FALSE
)
Arguments
- results
The scMultisim result object
- seed
The random seed
- grn.genes.only
Plot the GRN gens only
- save
save the plot as pdf
Examples
results <- sim_example_200_cells()
#> Time spent: 0.01 mins
plot_gene_module_cor_heatmap(results)

#> NULL