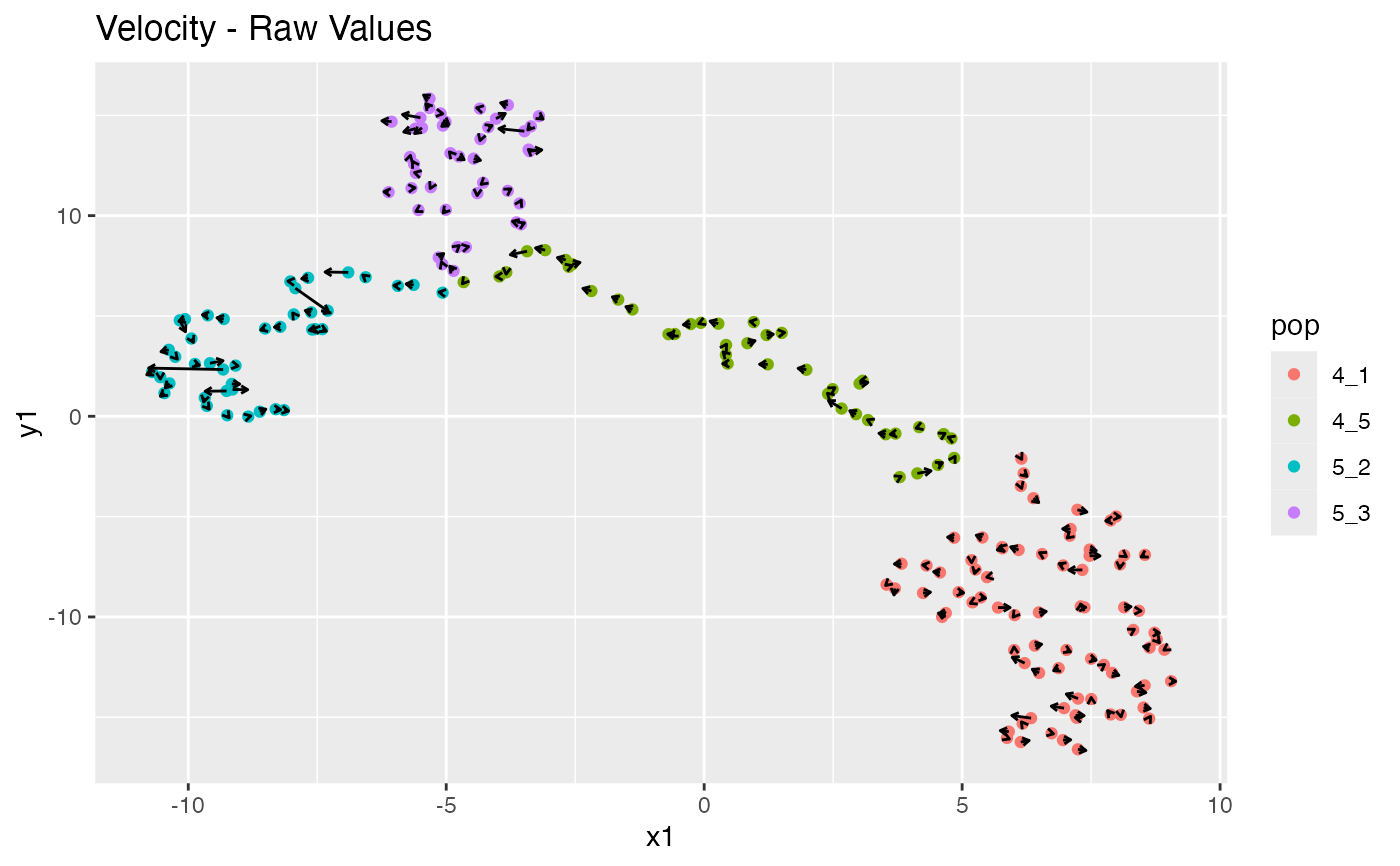
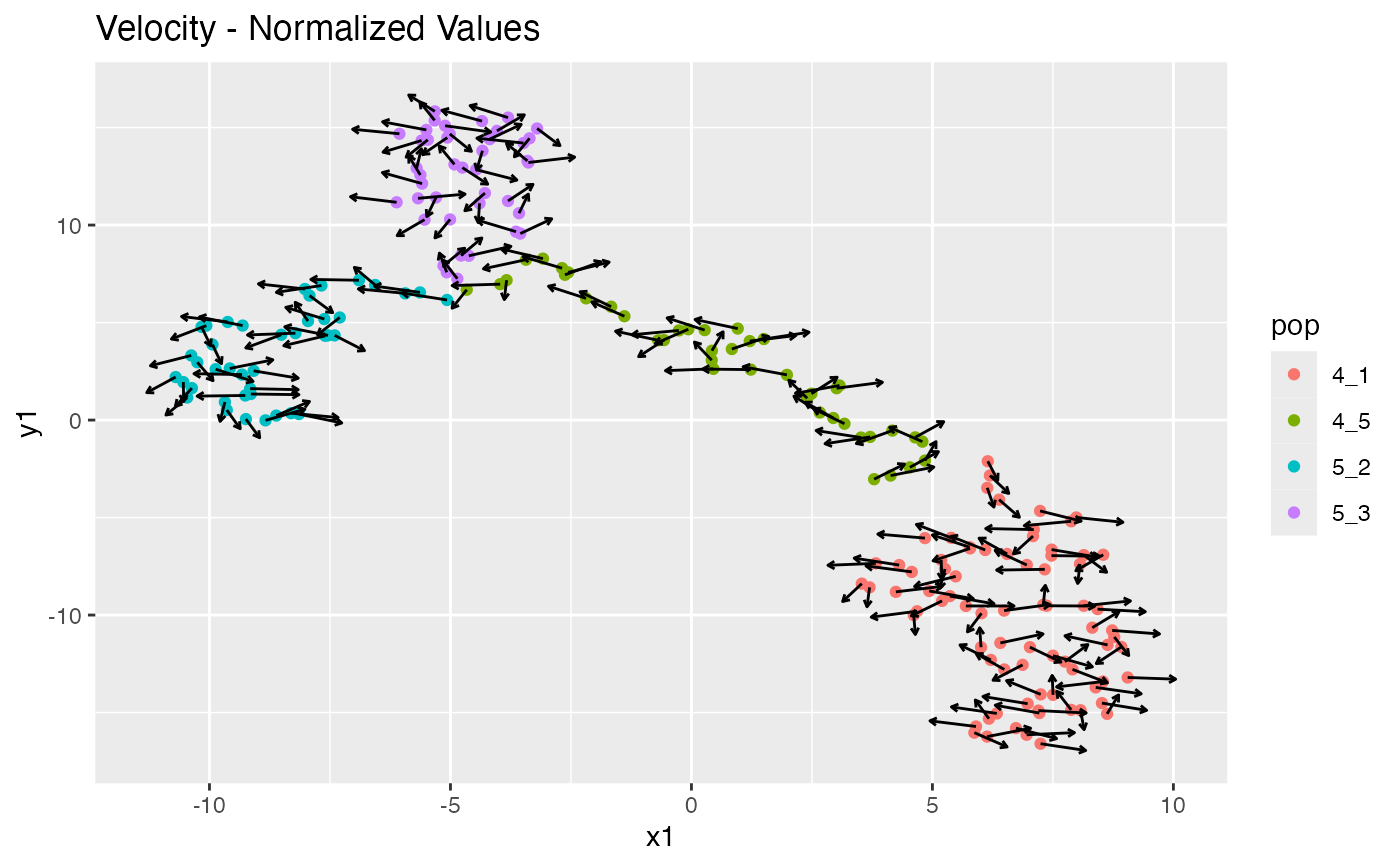
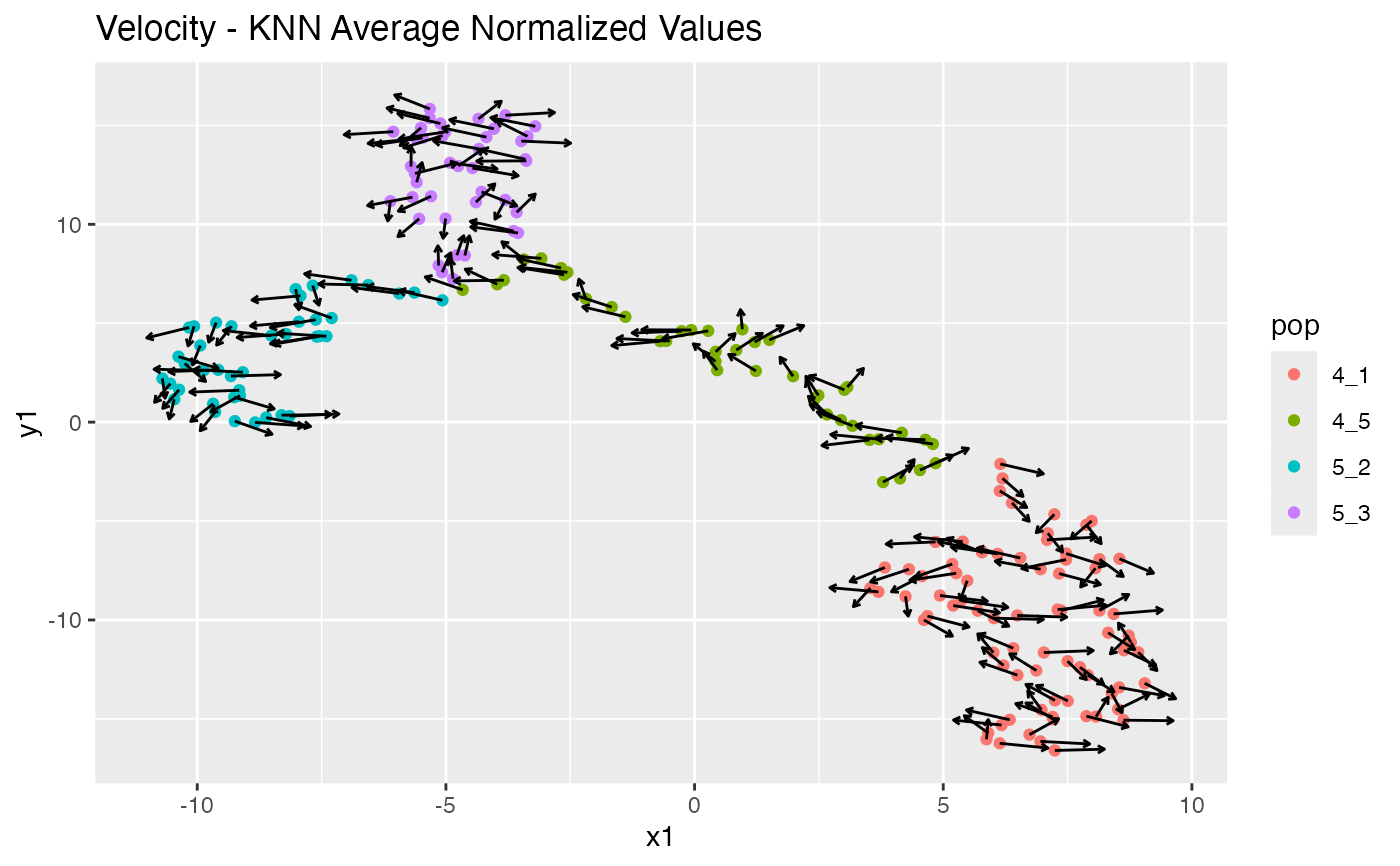
Plot RNA velocity as arrows on tSNE plot
Usage
plot_rna_velocity(
  results = .getResultsFromGlobal(),
  velocity = results$velocity,
  perplexity = 70,
  arrow.length = 1,
  save = FALSE,
  randseed = 0,
  ...
)
Arguments
- results
The scMultiSim result object
- velocity
The velocity matrix, by default using the velocity matrix in the result object
- perplexity
The perplexity for tSNE
- arrow.length
The length scaler of the arrow
- save
Whether to save the plot
- randseed
The random seed
- ...
Other parameters passed to ggplot
Examples
results <- sim_example_200_cells(velocity = TRUE)
#> Time spent: 0.05 mins
plot_rna_velocity(results)
#> $raw
 #>
#> $normalized
#>
#> $normalized
 #>
#> $knn_normalized
#>
#> $knn_normalized
 #>
#>