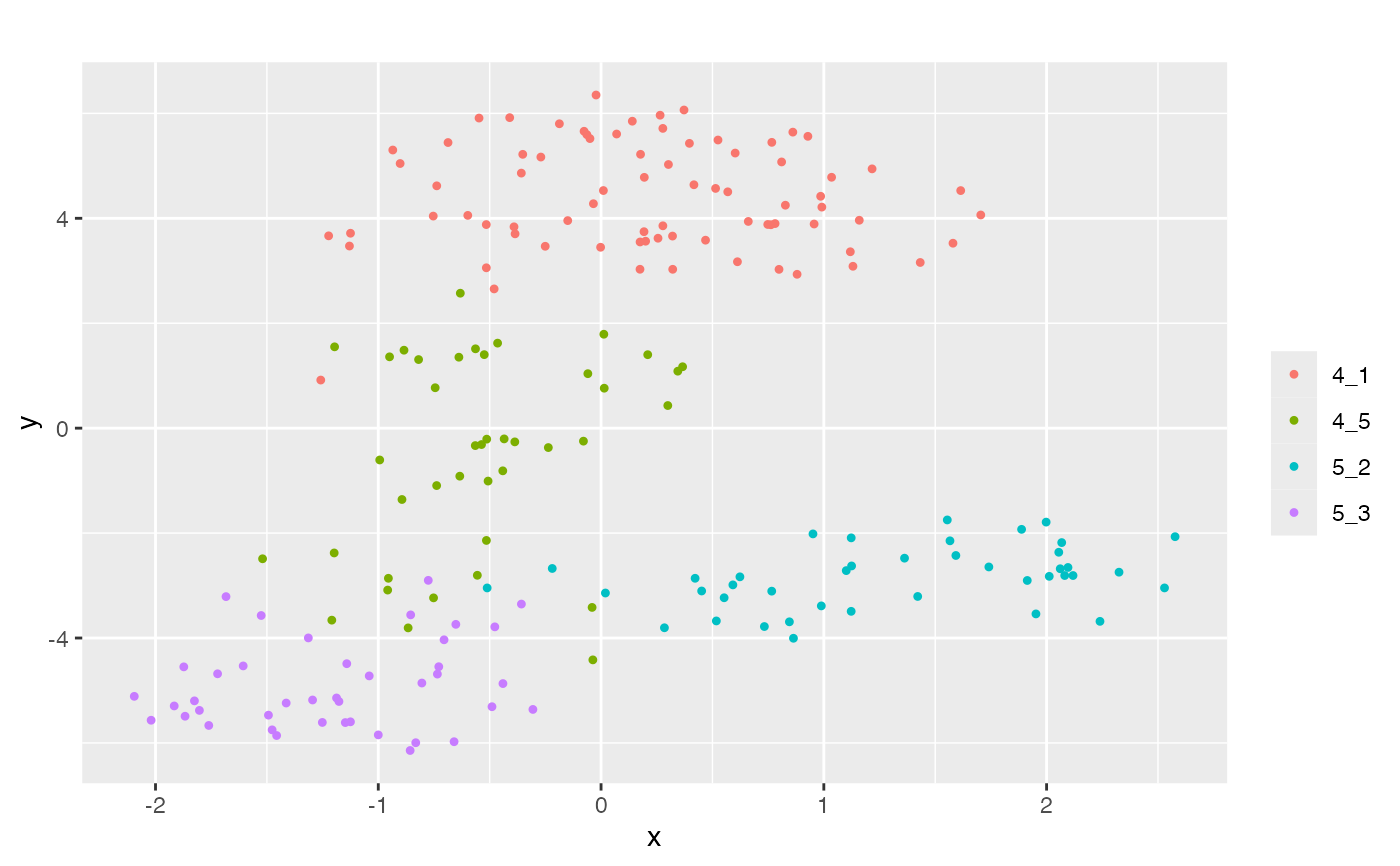
Plot t-SNE visualization of a data matrix
Usage
plot_tsne(
  data,
  labels,
  perplexity = 60,
  legend = "",
  plot.name = "",
  save = FALSE,
  rand.seed = 0,
  continuous = FALSE,
  labels2 = NULL,
  lim = NULL,
  runPCA = FALSE,
  alpha = 1
)
Arguments
- data
The
dxnmatrix- labels
A vector of length
n, usually cell clusters- perplexity
Perplexity value used for t-SNE
- legend
A list of colors for the labels
- plot.name
The plot title
- save
If
TRUE, save asplot.name.pdf- rand.seed
The random seed
- continuous
Whether
labelsshould be treated as continuous, e.g. pseudotime- labels2
Additional label
- lim
Specify the xlim and y lim c(x_min, x_max, y_min, y_max)
Examples
results <- sim_example_200_cells()
#> Time spent: 0.01 mins
plot_tsne(log2(results$counts + 1), results$cell_meta$pop)